The Stealth Bear Market
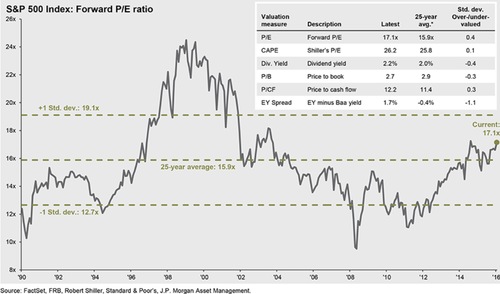
With equity valuations extended, and earnings growth in the 5th consecutive quarter of recession [i], it's hard not to wonder when a correction, or worse, a bear market might ensue. Confounding the situation is all the positive macroeconomic news which suggests the current market strength might continue.
After presenting to a recent investment committee, my colleague reminded me of a simple fact – we have had two full market corrections, both with 11% corrections, in the last twelve months: One in August 2015 and one in January 2016. [ii]

August 2015
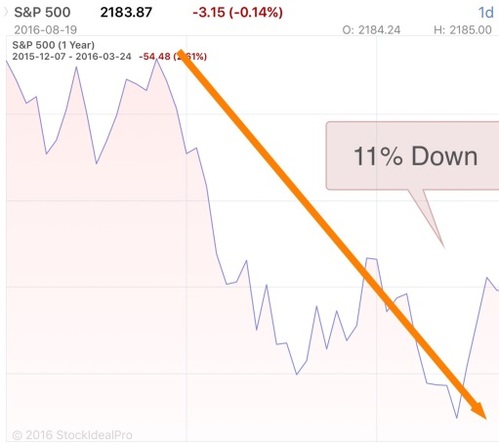
January 2016
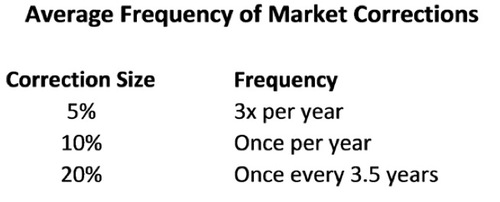
In fact, when you look at the average number of times we have market corrections during a year, which is defined as a 10% price drop, we are right on track. [iii]
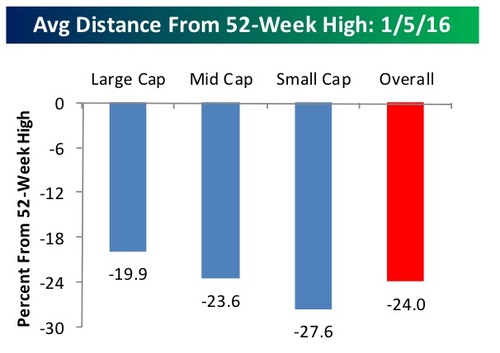
Contemplating this further, not only have we had two full corrections, we have actually had a bear market, which is defined as a 20% drop in price. [iv]
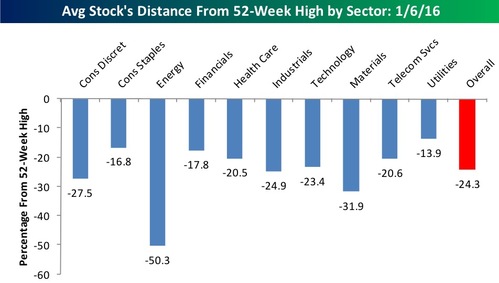
Recall, if you will, that at the start of this year, we had a pretty significant pull-back in the market. While the widely followed S&P 500 was down 11%, it was a different story when looking at the broader markets. The S&P 1500 was in bear market territory, while Small Cap was in an even more dramatic bear market. (Data provided by our research vendor Bespoke.)
When you break down the segments of the S&P 1500 market, many of those segments were also in bear market territory.
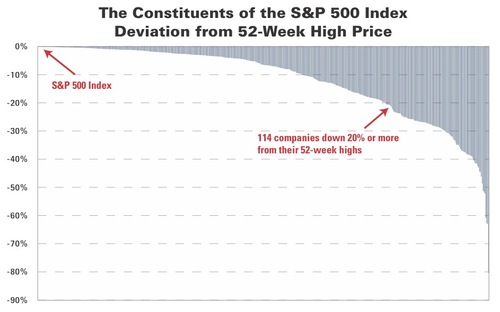
For example, on January 8th, 2016, 229 of the S&P 500 stocks were down at least 20% according to USA Today. While the S&P, Dow, and NASDAQ were only down around 10%-12%, almost half of the S&P 500 stocks were in bear market territory. [v]
As recently as July 12th when the markets were hitting all-time highs, 23% of stocks were still down 20%.
We live in a Central Bank policy driven world, and perhaps one of the consequences is a stealth bear market where some sectors correct and typical indexes do not reflect those corrections as much.
A bear market that does not get widely recognized may be a result of the cap-weighted tendencies of the headline indexes, where mega-cap stocks like Amazon, Apple, Google, and Facebook support the indexes while other constituents are correcting.
Stealth bear markets may be the new norm, and perhaps that's why the traditional indexes continue to rally in spite of the earnings drought we are in.
If you have questions or comments, please let us know as we always appreciate your feedback. You can get in touch with us via Twitter, Facebook, or you can email me directly. For additional information on this, please visit our website.
Tim Phillips, CEO – Phillips & Company
References
[i] Source: FactSet, FRB, Robert Shiller, Standard & Poor’s, J.P. Morgan Asset Management
[ii] StockIdeal Pro
[iii] Fidelity Investments. (June 4, 2012). CMSG Update on Recent Market Volatility
[iv] Bespoke Investment Group (January 7, 2016) B.I.G. Tips, “Average” Stock in Bear Market Territory, p. 1
[v] https://www.bbh.com/en-us/insights/strategy-insight--up--up-and-away/16740