Time for the Filter: Weather vs Strong Dollar
The time is growing near when we can start to filter the economic and earnings data from the general noise in the typical information flow of the markets.
In my opinion, the classic Bull vs Bear clash will break down to two themes that are on the same side of the coin. Both seem to support a slowing in corporate earnings growth and perhaps an overall slowdown in the macro US economy.
- One might be discounted as a temporary issue and continue to propel our equity markets higher - The Bull Case.
- The other might portend a natural correction in equity markets between 5% and 20%
- The Bear Case.
Call it “Weather vs Strong Dollar” with Weather being the temporary bull case scenario.
When it comes to the weather, you can see some data that suggest the very harsh weather that swept the country (except in Oregon) has had an impact on macro US economic output.
The recent jobs report on Friday was one of the slowest since January 2014.[i]
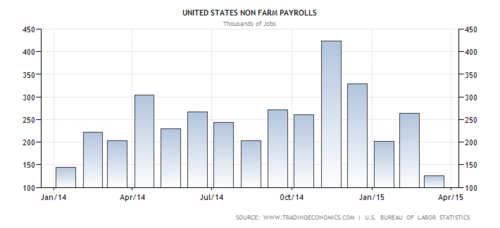
While the 12-month average was still very strong with over 200,000 jobs added monthly, the March figure was still weak.[i]
When you drill down into the data you can see the major industries with some of the weakest additions came from those that are weather sensitive: mining and logging, construction, and leisure/hospitality.[ii]

On the other hand, you can see from the same jobs report the impact of the strong US Dollar. When you examine the same table above, you can see one other sector that had very weak jobs growth - manufacturing.[ii]
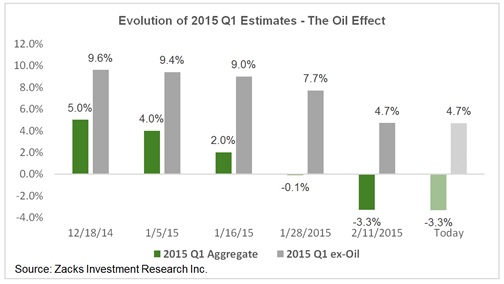
In the case of the strong US Dollar, it's a harder data point to discount as it can have a major impact on corporate earnings, which are only a couple of weeks from being reported.
Again, you can see from the data below, expectations are for a very weak earnings season.[iii]
If in fact earnings come in this weak, we could see a reversion to the mean valuation on the S&P 500. This would amount to a 5.3% decline.[iv,v]
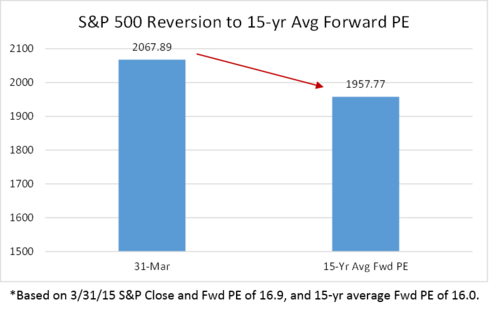
While a pullback in price would not be out of the question, there are lots of ways for corporate officers to adjust to lower expectations. On average, CFO’s are providing Q1 earnings estimates that are 9.2% below analyst expectations, but this is slightly better than their 5-year guidance average of 11.3% below analyst expectations.[vi]
Over the next couple of weeks, we are going to compare the dollar impact to the weather impact to see how this clash plays out.
Our focus points from an allocation perspective are to continue to manage duration and to consider micro caps, domestic banking, and perhaps increasing our exposure to emerging markets from our current levels.
If you have questions or comments, please let us know as we always appreciate your feedback. You can get in touch with us via Twitter, Facebook, or you can email me directly. For additional information on this, please visit our website.
Tim Phillips, CEO – Phillips & Company
Jeff Paul, Senior Investment Analyst – Phillips & Company
References
[i] TradingEconomics. (Apr 6, 2015). United States Non Farm Payrolls.
[ii] Bureau of Labor Statistics. (Apr 6, 2015). Employment Situtation Summary Table B. (March 2015).
[iii] Mian, S. (Apr 2, 2015). Q1 Earnings Season is Spotlight as Alcoa (AA) Reports Results. Zacks.
[iv] Yahoo Finance. (Apr 6, 2015). S&P 500 Historical Prices.
[v] JP Morgan. (Mar 31, 2015). 2Q Guide to the Markets. Returns and Valuations by Sector.
[vi] Butters, J. (Mar 31, 2015). Guidance: S&P 500. FactSet.