U.S. Economic Soft Spot or Rise of the Locust?

With just a couple trading days left in the month, October is shaping up to be one of the worst months for equity returns in decades. [i]
As of Friday, October 26, the indices have seen their largest drop since the correction we experienced between late January and early February of this year. [i]
The Dow Jones Industrial Average is down 6.69 percent [i]
The S&P 500 is down 8.76 percent [i]
The Nasdaq is down 10.93 percent [i]
The Russell 2000 (Small Cap Index) is down 12.54 percent [i]
The U.S. equity markets are not alone in this misery. According to Bespoke Investment Group, all major equity markets are down, and many are in bear-market territory. [ii]
Someone once said, “Anything can happen when investing in stocks and usually does.” That’s certainly true for the month of October.
This is the question at hand: Is this a soft spot, or is there a bear-market ahead?
It’s always been our theory that investors will look ahead into 2019 for clues to help them determine the fair market value for U.S. stocks right now. As you can see from the table below, courtesy of our friends at Bespoke Investment Group, the proof is in investor reaction to good earnings. [ii]
Typically, when companies beat earnings, their stock goes up by an average of 1.89 percent. Now it’s a measly 0.09 percent. [ii]
Based upon the outcomes and investor reaction during October, it’s likely they have been digesting the following data:
Housing Market: The housing market has dramatically cooled. New Home Sales are down 13.2 percent year-over-year. [i]
Auto Industry: New Auto Sales have begun to decline as well. As of September’s numbers, new sales are down 5.9 percent year-over-year. [i]
Business Capital Expenditures: Business CapEx, was aggressively incentivized through the new tax legislation, but has since begun to decelerate. The NFIB Small Business Association reports CapEx has declined 9 percent from the highs in February of this year. [i]
Interest Rates: It’s no secret that interest rates have been on the rise. The 30-year mortgage rate has increased 23 percent year-to-date to 4.86 percent. We haven’t seen mortgage rates that high since April 2011. [iii]
Simultaneously, investors appear to be discounting some fairly positive data points:
Corporate Earnings: 2019 corporate earnings are expected to grow by 10 percent and maintain growth above the long-term average. [iv]
GDP: Q3 2018 GDP growth came in at 3.5 percent on an annualized basis. [v]
Unemployment: Unemployment has continued to fall to historic lows of 3.7 percent. [vi]
Stock Buybacks: Stock buybacks are projected to achieve record highs of $845 billion. [vii] [viii]
Which set of data is right?
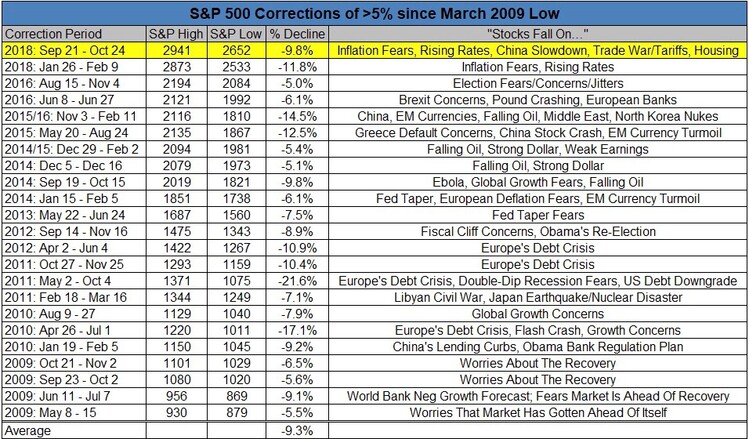
It’s always hard to tell when you’re in a classic “Bull-Bear” clash at a possible economic inflection point. However, after investing professionally for over 30-years (1985-2018), I’ve seen a lot. I recently found the below table that may help you gain some perspective on this current volatility. [ix]

We’ve been here before! That should be the conclusion after reviewing the above table.
So, is this an economic soft spot, or will we start seeing locusts settling upon equity prices?
To me, this looks like an economic soft spot driven by trade uncertainty, rising interest rates, political instability, a strong dollar, and a host of other transitory issues.
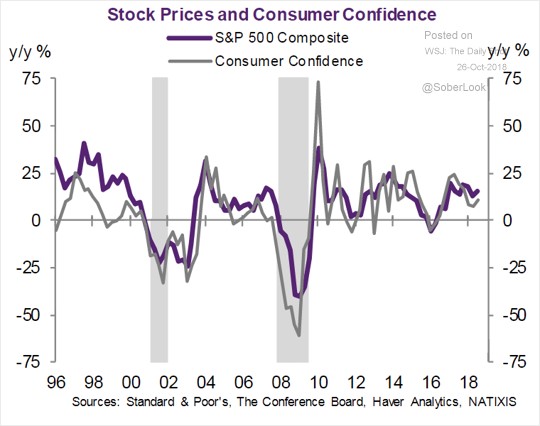
The only immediate worry I lose sleep over is consumer confidence. As we all know, America is a consumption-driven macroeconomic model, that’s driven by consumer confidence. [v]
Prolonged market drawdowns can lead to deteriorating consumer confidence, which can restrict consumption. Needless to say, this has a negative feedback loop. [x]

By the way, the Federal Reserve knows this too.
I see no locusts yet because equity prices correcting also makes them more fairly valued going forward. [i]
In fact, in just one month we have seen valuations drop significantly:
S&P 500 Forward P/E Ratio dropped from 18.05 to 16.30, 9.7 percent [i]
Nasdaq Forward P/E dropped from 24.05 to 15.49, 13.2 percent [i]
Dow Jones Industrial Average Forward P/E dropped from 16.94 to 15.49, 8.6 percent [i]
The Russell 2000 Forward P/E dropped from 27.56 to 24.13, 12.5 percent [i]
To provide a little global perspective, The Hang Seng (China) Forward P/E dropped from 11.47 to 10.29, 10.3 percent [i]
Ultimately, buyers will return to the equity markets and snatch up good values—they always do. In my opinion, we’re in an economic soft spot. I don’t see any end-of-the-world scenarios lurking around.
If you have questions or comments, please let us know. You can contact us via Twitter and Facebook, or you can e-mail Tim directly. For additional information, please visit our website.
Tim Phillips, CEO, Phillips & Company
Robert Dinelli, Investment Analyst, Phillips & Company
References:
i. Bloomberg, L.P.
ii. Bespoke Investment Group (Subscription)
iii. https://fred.stlouisfed.org/series/MORTGAGE30US
iv. https://phillipsandco.com/files/6615/3876/8981/Look_Ahead_2018Q4_-_Final.pdf
v. https://www.bea.gov/system/files/2018-10/gdp3q18_adv_2_0.pdf
vi. https://fred.stlouisfed.org/series/UNRATE
vii. https://www.bloomberg.com/news/articles/2018-03-02/-800-billion-buyback-guess-is-latest-bombshell-in-tax-cut-debate
viii. https://us.spindices.com/indices/equity/sp-500
ix. https://pensionpartners.com/why-are-stocks-going-down/
x. https://blogs.wsj.com/dailyshot/2018/10/26/the-daily-shot-so-much-for-the-tax-driven-business-investment-boom/ (Subscription)