Watching Coconuts and Fish or the Island… What Matters More?

The U.S. debt level just blew the doors off any expectations. Late last week the U.S. Department of the Treasury reported U.S. debt levels that topped $21 trillion. [i]
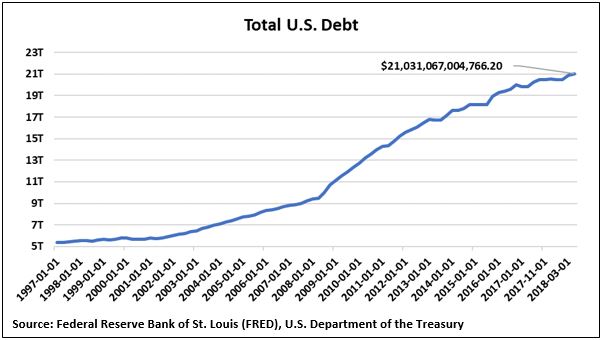
Make no mistake, this is the highest level of debt on record.
It also puts the U.S. economy at a debt-to-GDP level not seen since World War II in 1945. [ii]
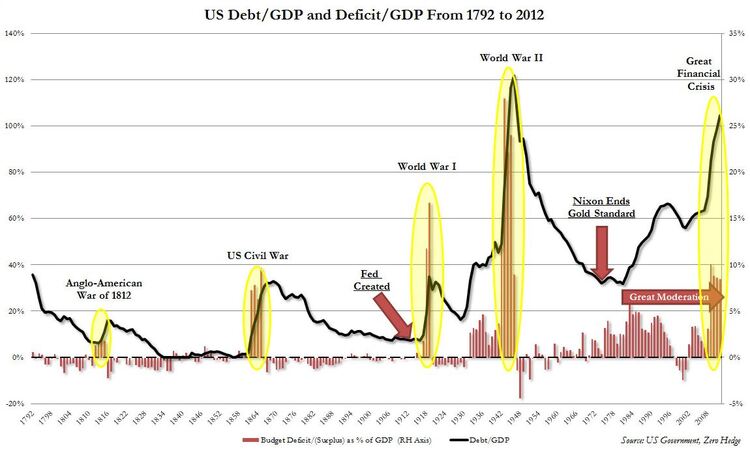
Just to put this into context, the lowest debt-to-GDP ratio since the Fed was created in 1913 was just shy of 20 percent in 1930. The highest happened to be post-World War II in 1945, when the level topped 120 percent. [ii]
Despite the significance of this ratio being widely debated, the fact remains that this is a measure of the cumulative deficit the United States runs over its entire history compared with the current year’s total output for the U.S. economy. In the chart above, you can see that the United States has run some pretty large deficits, not to mention that those deficits have continued into present time. [iii]
Among the many reasons for the deficits, a few worth noting are as follows:
- The recent tax cuts are projected to add $1 trillion to U.S. debt over the next decade. [iv]
- Healthcare (Medicare and Medicaid) spending is likely to continue increasing as a result of population growth (aging population); in 2015, government healthcare spending was 27.42 percent of total federal spending. [v]
- The Great Financial Crisis added $1.4 trillion to the deficit. [iii]
Although consensus thinking would lead most people to be alarmed at the growing debt, and perhaps we should be, the consequences of the debt are what we should be focusing on.
Is the current level of debt, and more relevant, the cost to service this debt (interest payments), an issue?
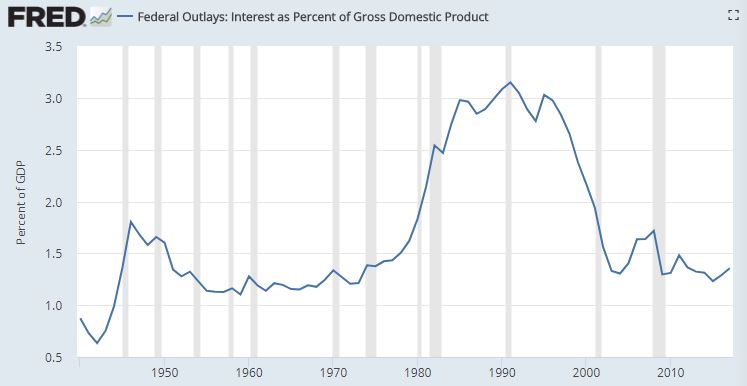
Current debt service as a percent of U.S. GDP is 1.36 percent. [vi]
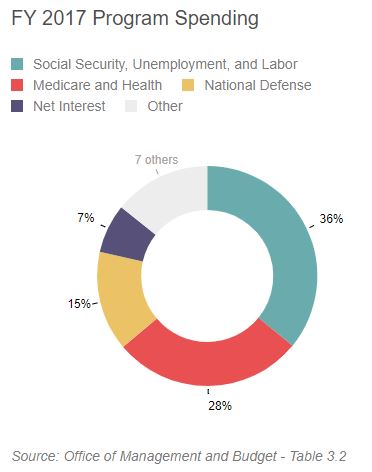
Please realize that debt service payments are not necessarily additive to the economy. If you accept that government spending on net interest is likely to remain around 7 percent of total government spending, which it was in 2017, then the more the government spends on debt service, the more likely it is to erode the contribution that government spending has on GDP growth. [vii]
Not to mention, some of that debt service expense is being paid to foreign holders of U.S. debt, such as China and Japan. [viii]
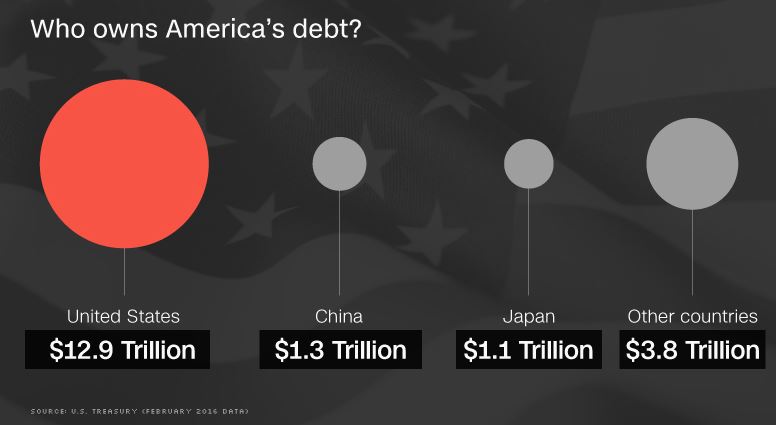
Based on this, we can conclude that interest payments on government spending erode GDP over time. What does this mean? It means that we’re likely going to lose out on some support to GDP growth as interest rates rise or deficit/debt levels grow.
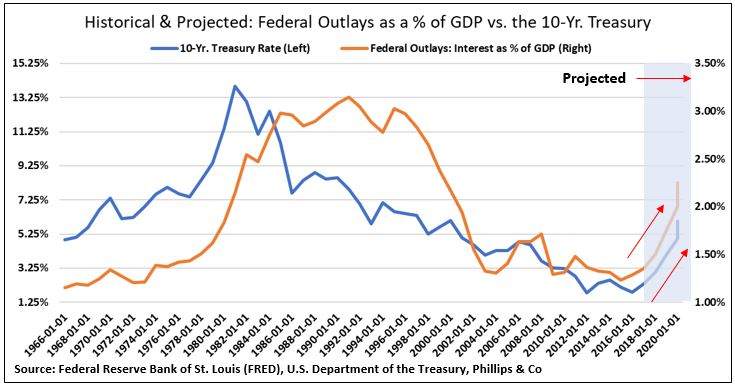
The relationship is easy to ascertain if you look at the comparison of debt service payments as a percentage of GDP relative to the 10-year Treasury yield. As the 10-year Treasury yield increases, it’s fair to assume (holding all else constant) that debt service as a percent of GDP is likely to increase as well.
In my opinion, as long as the economy continues to grow, we are not headed toward a financial hiccup. However, that’s a big assumption, because we know that nothing, including U.S. GDP growth, continues indefinitely without a period of slower growth or contraction.
Keep in mind, I’m not that worried about the debt level or debt service payments, as long as interest rates remain at low levels. I’m not even that worried about changes and fluctuations in GDP growth levels because they happen all the time.
What I do worry about is the changes in asset values. Renowned economist John Rutledge has said to me on several occasions, “Changes in asset values matter, not changes in economic flows [GDP].” Additionally, he refers to our economy as our “Island Economy.”
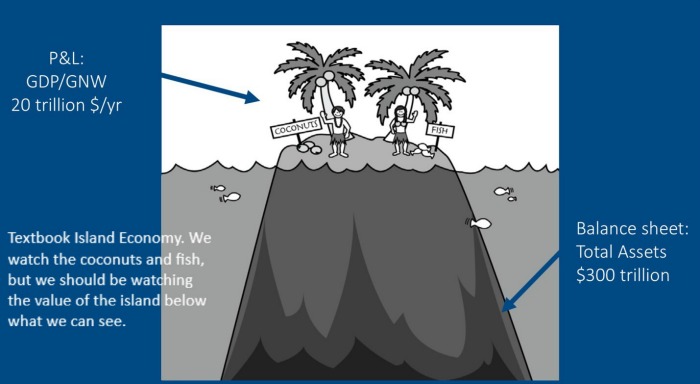
Although we have approximately $20 trillion in annual GDP, any small change to approximately $300 trillion in total assets would have a much larger impact. For example, a 1 percent change in asset value ($3 trillion) is equal to 15 percent of annual GDP. [iv] [v]
Let’s keep an eye on the island as well as the coconuts and fish. It’s simple math!
If you have questions or comments, please let us know. You can contact us via Twitter and Facebook, or you can e-mail Tim directly. For additional information, please visit our website.
Tim Phillips, CEO, Phillips & Company
Robert Dinelli, Investment Analyst, Phillips & Company
References:
i. https://www.treasurydirect.gov/govt/reports/pd/pd_debttothepenny.htm
ii. https://www.zerohedge.com/news/2012-12-17/charting-us-debt-and-deficit-inception
iii. https://alfred.stlouisfed.org/series?seid=M318501A027NBEA&utm_source=series_page&utm_medium=related_content&utm_term=related_resources&utm_campaign=alfred
iv. http://www.newsweek.com/trump-tax-cuts-fear-deficits-us-national-debt-republicans-corker-wealthy-752341
v. https://www.nationalpriorities.org/budget-basics/federal-budget-101/spending/
vi. https://fred.stlouisfed.org/series/FYOIGDA188S
vii. http://federal-budget.insidegov.com/l/120/2017-Estimate
viii. http://money.cnn.com/2016/05/10/news/economy/us-debt-ownership/index.html
ix. https://www.bea.gov/newsreleases/national/gdp/2018/pdf/gdp4q17_2nd.pdf
x. https://en.wikipedia.org/wiki/Financial_position_of_the_United_States#cite_note-2014Q1flowoffunds-1 (Indexed for inflation)