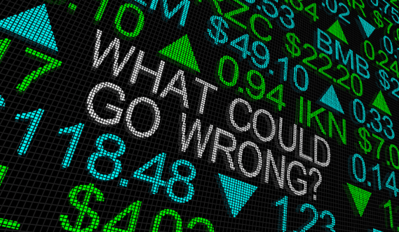
What Could Possibly Go Wrong?
I am certain most readers of this weekly commentary have heard of the new stock trading app Robinhood which allows individual investors to buy small quantities of stock in their favorite companies. It’s been all the rage with younger, less experienced investors. Some conjecture? It’s because they are “COVID bored” and, perhaps, because there have been no sports to bet on.
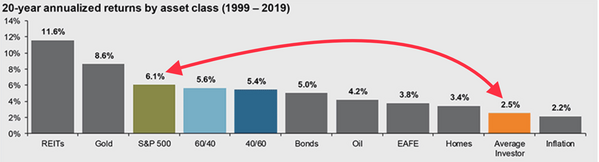
If true, what could possibly go wrong with this approach? Historically, individual investors tend to grossly underperform most asset classes mainly due to excessive trading. [i]
In fact, individual investors have been so historically wrong, that there are contrarian indicators professional investors use to gauge their enthusiasm. The American Association of Individual Investors publishes bullish and bearish sentiment amongst individual investors taken from their weekly surveys. [ii]
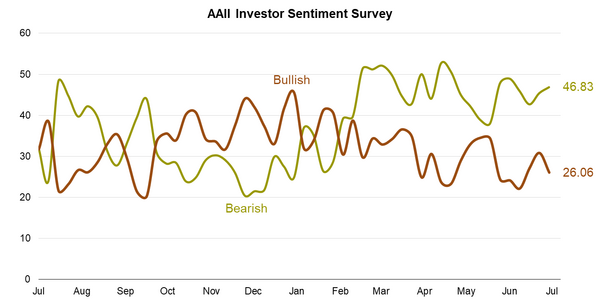
From this data you can see the average investor is extremely bearish right now, with the bearish indicator well above the 20-year average for bearishness of 32.3 and the bullish sentiment indicator well below its 20-year average of 38.7.
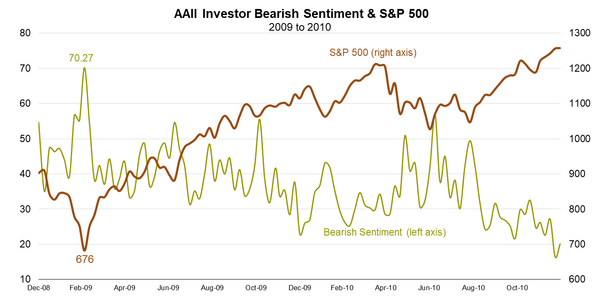
So, how good is this indicator? During the financial crisis the individual investor was a perfect contra-indicator for the bottom of the market. They were at extreme levels of bearishness when the markets took off on a historic bull market run that was the longest in the history of the markets. [ii] [iii]
Let’s turn our attention to the new day trading craze. Both Robinhood and Charles Schwab are exhibiting some excessive volume. [iv]
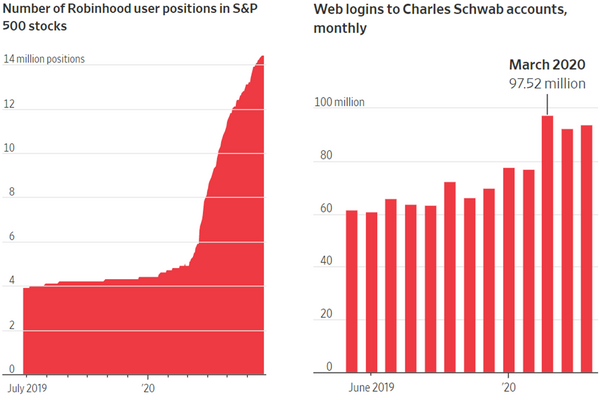
Certainly not comforting news if the contrarian data holds true when it comes to individual investors. With the Robinhood and Schwab crowd jumping into stock positions, this couldn’t be good news. Or could it?
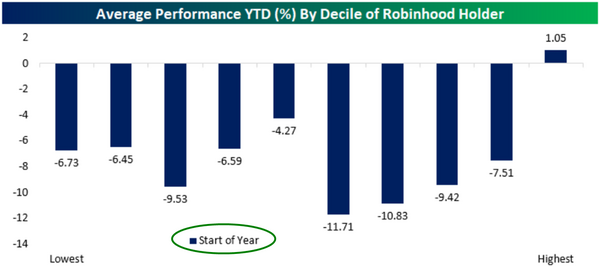
By decile, the largest amount of Robinhood accounts that owned a stock at the start of the year are up just over 1% compared to an average decline of 6.9% for companies in the S&P 500. That’s not bad. [v]
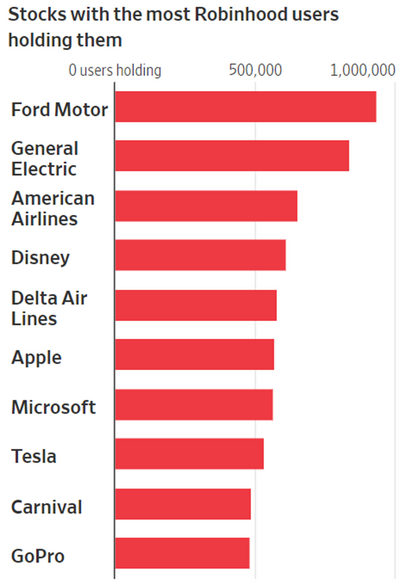
When looking at the largest holdings, you get the picture for what they are buying. It would appear Robinhood investors are bottom fishing for COVID companies that could bounce. Not a bad strategy. [iv]
Maybe the madness of crowds is not so mad. It’s possible they are looking well past the current COVID panic towards a brighter future.
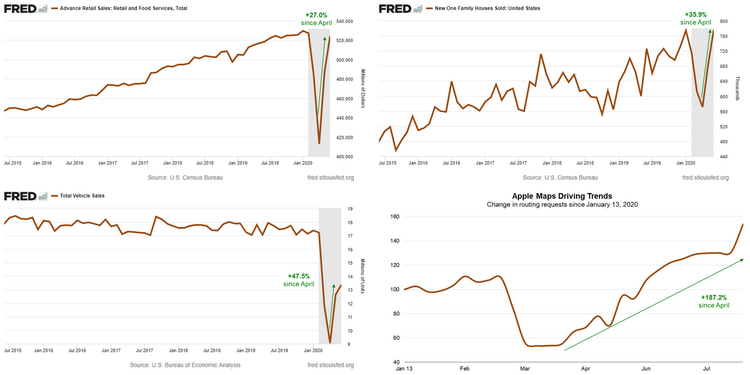
Just look at the most recent indicators―retail sales, new home sales, auto sales, and requests for driving directions on Apple Maps have all bounced significantly off the April lows. [vi] [vii] [viii] [ix]
As far as moving the markets, it’s hard to suggest Robinhood investors are moving markets with their volume. According to JMP Securities, the average account size for a Robinhood account ranges from $1,000 to $5,000 and the app passed 13 million users earlier this year. Using an average account size of $5,000 and 13 million users, that would give Robinhood’s userbase a capitalization of about $65 billion. Between February 19th and March 12th, the U.S. stock market lost approximately $11.5 trillion in market capitalization as COVID-19 hit. So, when looking at it from this perspective, it’s really tough to make the argument that Robinhood users have any real influence on the market. [x]
What could possibly go wrong? While the individual investor might be bored, miss gambling, or view the markets as a video game; it’s clear this time might be different. They might just be onto something.
If you have questions or comments, please let us know. You can contact us via Twitter and Facebook, or you can e-mail Tim directly. For additional information, please visit our website.
Tim Phillips, CEO, Phillips & Company
Sources:
i. https://PHILLIPSANDCO.COM/files/4915/7167/2924/5_Rules_For_Equity_Investors_2019-02-03_18_02_44.pdf
ii. https://www.aaii.com/sentimentsurvey
iii. https://www.bloomberg.com/quote/SPX:IND
iv. https://www.wsj.com/articles/everyones-a-day-trader-now-11595649609
v. https://www.bespokepremium.com/interactive/posts/chart-of-the-day/chart-of-the-day-the-myth-of-robinhood
vi. https://fred.stlouisfed.org/series/RSAFS
vii. https://fred.stlouisfed.org/series/HSN1F
viii. https://fred.stlouisfed.org/series/TOTALSA
ix. https://www.apple.com/covid19/mobility
x. https://www.jmpg.com/jmp-securities/research/