What Does It All Mean?
Last week during a CNBC interview, the famous Nobel Prize winner and Yale University professor, Robert Shiller, said, “It [the market] could go up 50 percent from here. That’s what it did around 2000; after it reached this level, it went up another 50 percent.” [i]
I’m not saying that I’m convinced this will happen, but a bold statement made by Shiller is worth exploring a bit more.
For those of you who don’t know, Robert Shiller is widely known throughout finance for his development alongside John Campbell of the cyclically adjusted price-to-earnings ratio, or CAPE ratio. Rather than showing the complex formula, an easy way to describe its calculation is by taking the current price and dividing it by the index’s average historical rolling ten-year earnings per share, while adjusting for inflation.
Here’s how it looks relative to the S&P 500’s trailing twelve-month P/E ratio over the same period. [ii]
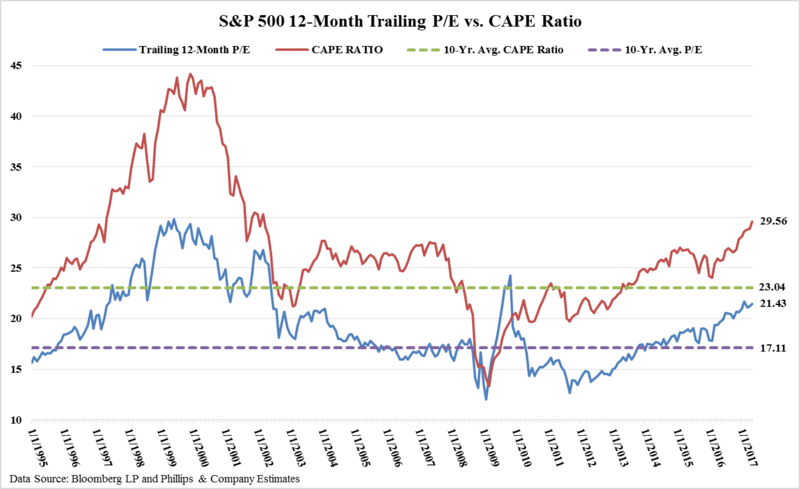
Based on Shiller and Campbell’s research of observing ten-year real stock returns against the CAPE ratio, they found that the CAPE ratio was able to significantly improve predictability in long-run stock returns. In its most basic form, when the CAPE is above its long-run average, the model predicts below-average real stock returns for the next ten years, and when it’s below its long-run average, the ratio predicts above-average real stock returns for the same time frame. [ii]
Provided that valuations are above their long-run averages, why would Shiller make such a statement? The simple answer is that it has previously happened. The CAPE ratio is a mean reverting indicator, which means it can and will likely repeat the past. [ii] However, the clear upward trend in the CAPE ratio is a strong argument for continued increasing valuations, even though the market is disagreeing with what the indicator is telling us.
So what is the indicator telling us now?
Well for starters, we’re clearly experiencing some level of divergence. The CAPE ratio is above its mean, yet we are experiencing above-average stock market returns. Be that as it may, the CAPE ratio has been above its mean since approximately 2014. Any period of meaningful correction or stint of a bear market between now and 2024 could result in the period delivering below-average returns. But how likely is that?
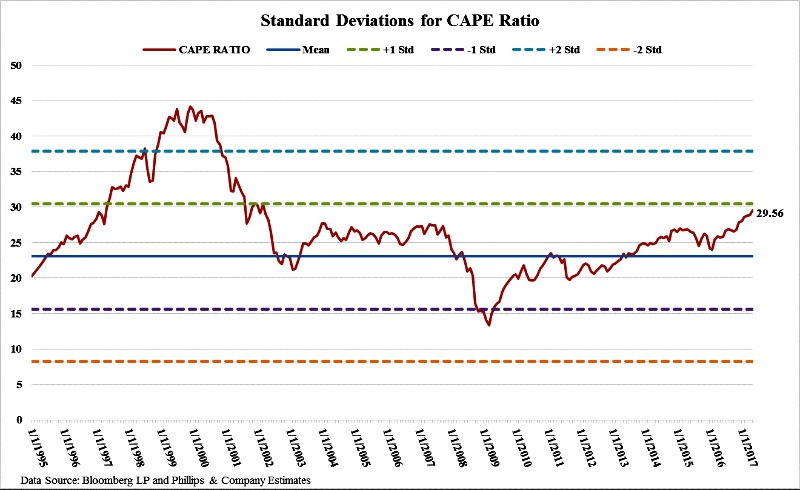
As you can see from the above graph, the CAPE ratio currently sits slightly below its one standard deviation. Considering its upward trend, it is completely in the realm of possibility that valuations will continue higher, and statistically speaking, there is approximately a 16 percent probability that the CAPE ratio will continue higher. [iii]
As the world becomes increasingly globalized, it’s important to take into consideration where valuations are on a global level and not just here in the United States.
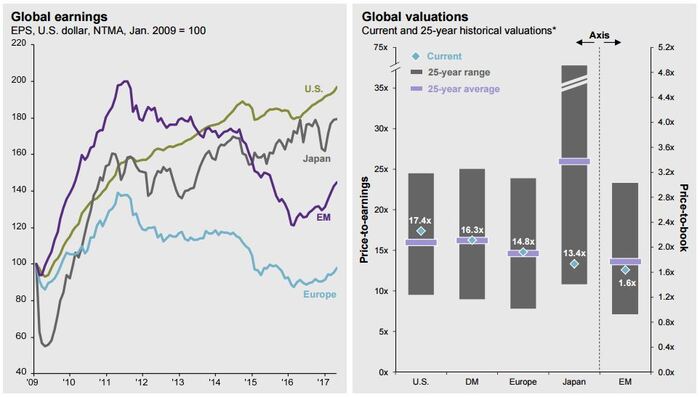
Based on historical levels, Europe and Emerging Markets appear to be valued at or below their long-run averages. From a portfolio management perspective, it’s imperative to understand your geographical exposure to make sure you’re positioned appropriately based on global valuations. [iv]
All in all, there are many factors at play that could easily impact where the markets head from here. Shiller’s comments aren’t unfounded, and in fact, seeing as the odds were not in favor of this current market rally, it’s quite possible that Shiller could be right. However, based purely on “pot odds,” increasing U.S. market valuations are not in favor.
If you have questions or comments, please let us know. We always appreciate your feedback. You can contact us via Twitter and Facebook, or you can e-mail me directly. For additional information, please visit our website.
Tim Phillips, CEO, Phillips & Company
Robert Dinelli, Investment Analyst, Phillips & Company
References:
i. http://www.cnbc.com/2017/05/23/robert-shiller-market-could-go-up-50-percent-from-here.html
ii. http://www.cfapubs.org/doi/pdf/10.2469/faj.v72.n3.1
iii. Bloomberg LP
iv. https://am.jpmorgan.com/blob-gim/protected/1383426387662/83456/MI-GTM_2Q17_May.pdf?segment=AMERICAS_US_ADV&locale=en_US