Where Are We?

It’s such a challenging time for investors with so many issues swirling around: rising interest rates, a ground war in Europe, inflation, recession fears, COVID lockdowns in China, Fed policy errors, the list goes on.
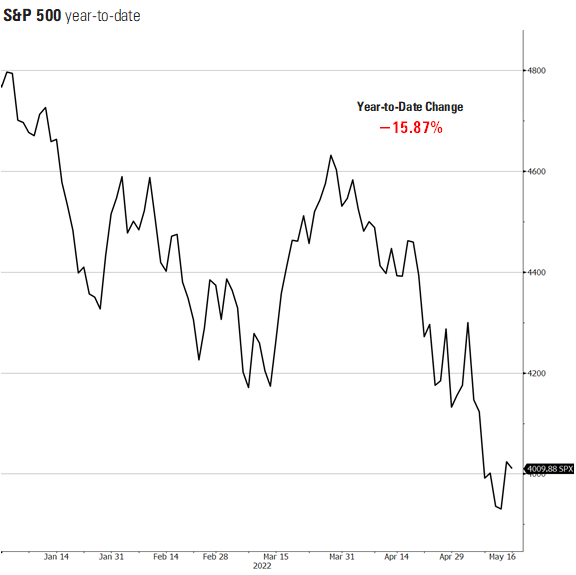
The S&P 500 is down almost 16% this year. From my experience, it’s around this time in the cycle that investors take pause. 1
Trying to anchor your expectations to something or some event is a natural tendency for any investor. That’s particularly true if your investments are designed to support your lifestyle.
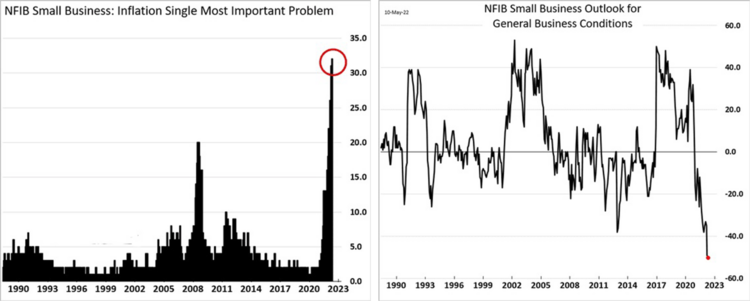
It’s my view, and that of small business, the main driver amongst all the various threats to the U.S. economy is still inflation. According to the recent NFIB (National Federation of Independent Business), inflation is the single most important issue facing the economy. In fact, it’s the factor causing small business’ future economic outlook to crater. At -50%, it’s the lowest reading in the 48-year history of the survey. 2
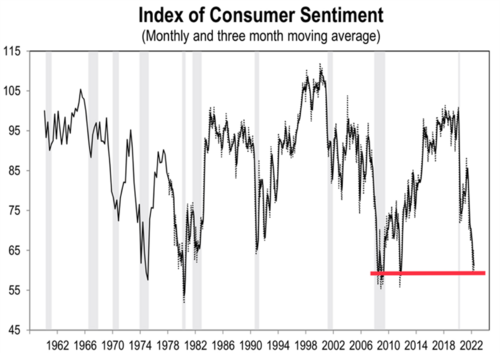
Further, the most recent release from the University of Michigan Consumer Sentiment Index gave a very bearish reading not seen since 2011. It would appear both businesses and consumers are growing very pessimistic. 3
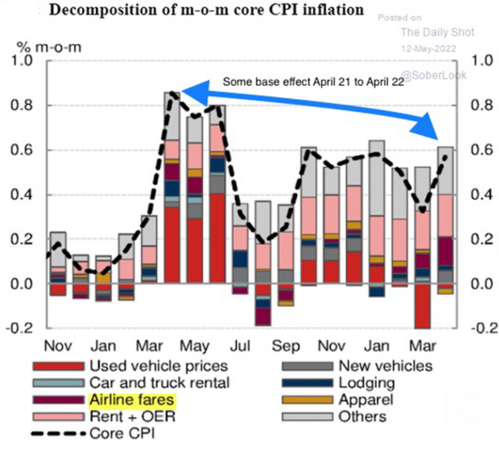
However, there is some modestly good news in the most recent inflation numbers. On a year-over-year basis, the monthly change in inflation readings from April 2021 to April 2022 was slightly constructive. Perhaps the worst is behind us on the inflation front. 4
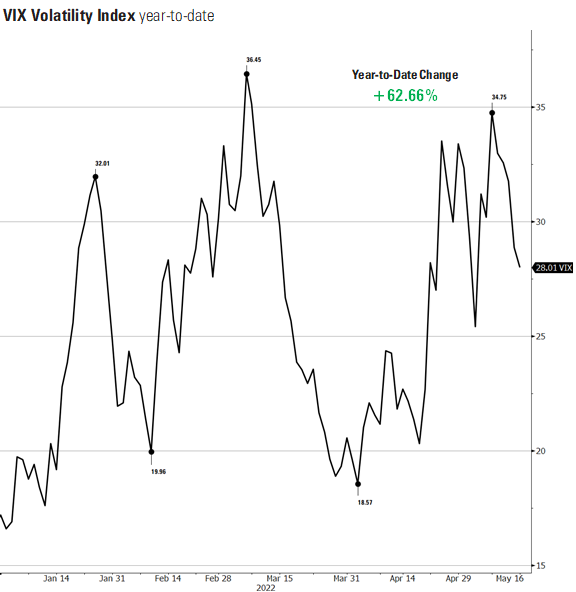
Yet, that doesn’t mean the worst is over for equity volatility. Equity volatility is part of the process when we are going through an economic cycle change. The VIX index has spiked this year and there is certainly more room for equity prices to contract. 5
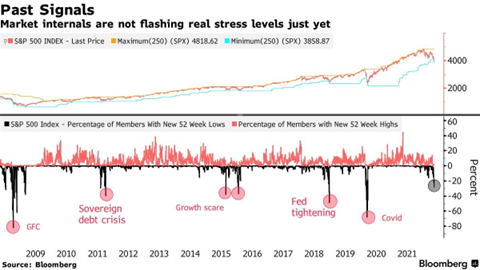
The percentage of S&P 500 companies hitting 52-week lows is still very modest at around 30% relative to past growth scares or Fed tightening cycles at around 40% to 50% making 52-week lows. 6
We need to realize in the last 13 years the S&P 500 has had some very volatile periods of time. It’s enough to test anyone’s nerves. After 126 days and 17.7% down on the S&P 500 this year (through May 10), it’s especially tough. However, if you look at the real bottom-line to the chart below, you can see the real power in looking past the noise. 7
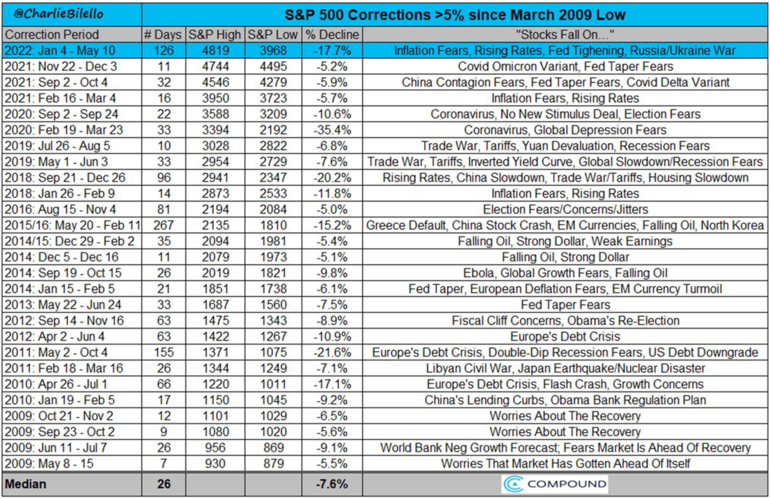
In spite of and perhaps because of all the volatility the S&P 500 has compounded around 15% a year over the last 13 years.
Where are we in the cycle? It’s my guess that as inflation data starts to moderate even more in the coming months, the Fed will find a much better equilibrium in the interest rate picture for investors and consumers. The risk of recession should moderate and provide investors and consumers with a better outlook. It’s possible we are at the trough of sentiment and in the next two quarters the outlook stabilizes.
If you have questions or comments, please let us know. You can contact us via Twitter and Facebook, or you can e-mail Tim directly. For additional information, please visit our website.
Tim Phillips, CEO, Phillips & Company
Sources: