Will They Buy?

The last few weeks of each quarter typically pose some unusual market behavior. More volatile, erratic, and even negative performance is not atypical. 1
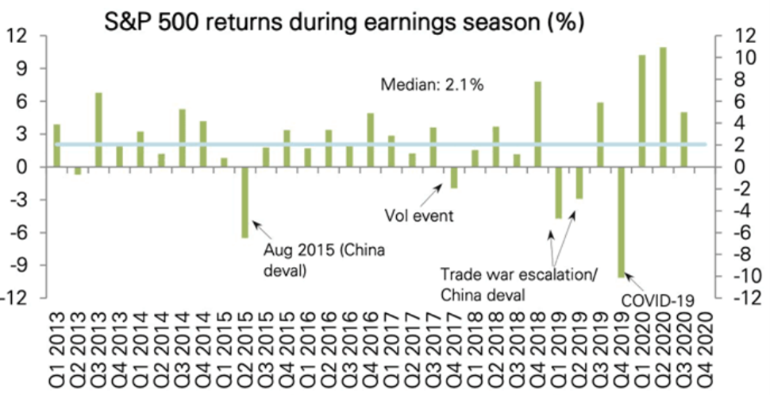
It is my view that the lack of concrete earnings news drives investors to latch onto the news du jour to make investment decisions.
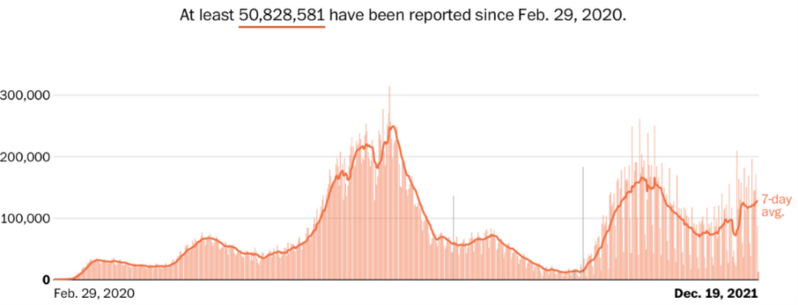
Can you imagine trying to make critical decisions based upon the various peaks and valleys of Covid? 2
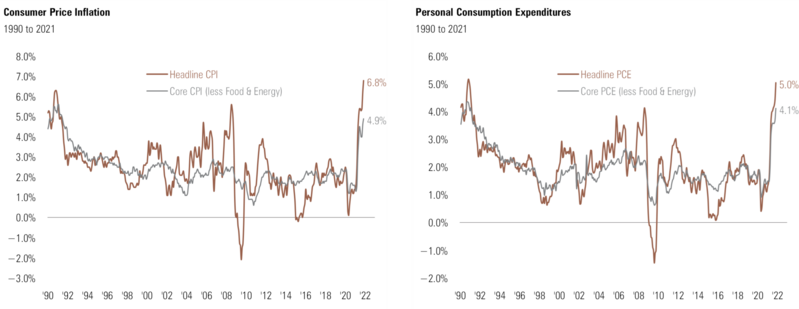
Even recent inflation data drives considerable investor discontent. 3 4
Without earnings to validate our decisions, we investors are left to the terrible task of filling in blanks. We all know how inaccurate humans can be when it comes to making things up when there is an absence of critical data.
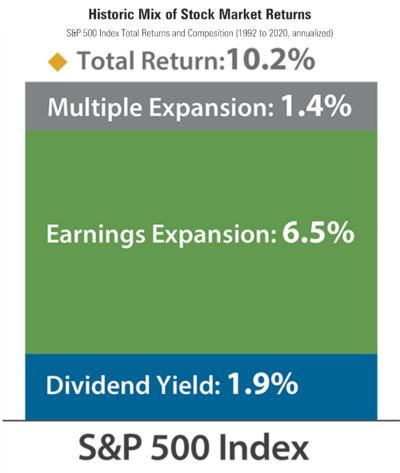
It’s proof that earnings matter most. Over very long periods of time, earnings (growth) drive the majority of stock prices compared to multiple expansion (speculation). 5
So, what data do I use as a professional investor when there is an absence of concrete earnings information to reflect on? The answer is incredibly simple: Consumption trends.
Corporations, large or small, in almost every industry rely upon the consumer for their earnings. In that vein, how is the U.S. consumer looking?
My typical consumer scorecard looks at a few critical hard-data inputs.
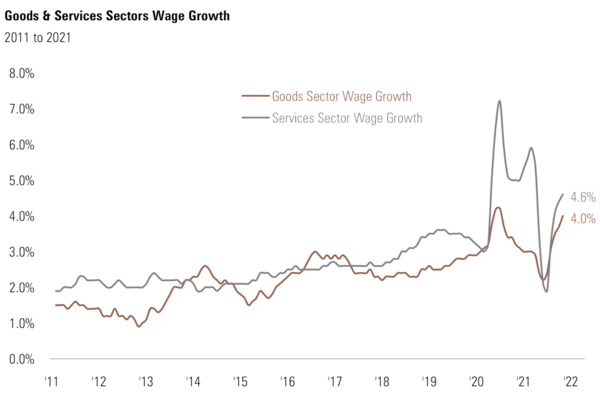
Wages are the fuel for spending and confidence. Current wage growth trends suggest the consumer should be in a strong position to continue along the path they have been on. 6
Beyond wages, consumers can spend down their savings. To that end, their precautionary savings continues to be spent down. 7
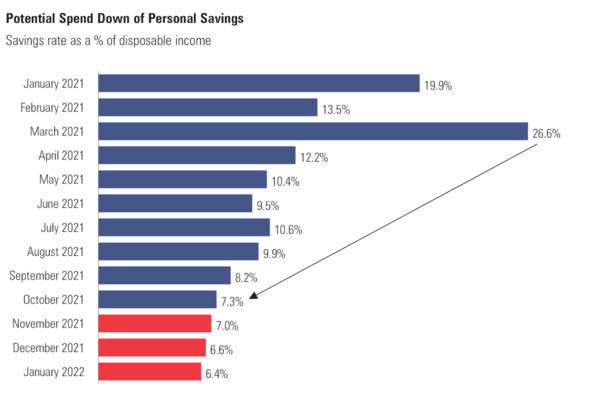
In fact, if consumers continue to spend down savings to pre-pandemic levels, they could add $358 billion back to GDP, or 1.55%.
There is another way consumers can get their hands on cash to spend: Credit. It’s so detrimental to future consumption yet, it’s a powerful elixir for current consumption trends. In terms of getting their hands on credit, consumers are still sitting on incredible debt servicing power relative to their income. 8
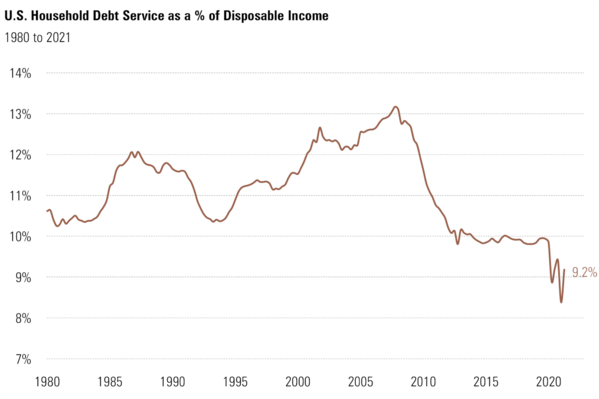
If consumers leverage up to pre-pandemic levels, they could add $140 billion to consumption, or 0.60% to GDP. If the consumer took to extremes and borrowed back to debt service levels commensurate with the Great Financial Crisis, they would add a whopping $723 billion, or 3.12% of GDP.
All the data suggests the consumer has the capacity to drive incredible spending that can fuel amazing corporate earnings. The only other consideration is their confidence, desire, or raw “animal spirits”—according to Keynesian economics—which unleashes their reserves.
According to the University of Michigan, consumer confidence trends improved in December despite recent Covid developments, inflationary pressures, a hawkish Federal Reserve, and near-record high gas prices. 9
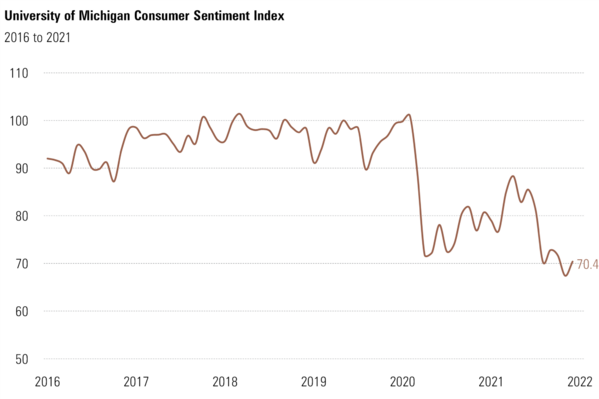
The current reading does not suggest the consumer is euphoric yet, it’s not a grim picture.
Blend in current retail sales (ex-autos and gasoline) to this data and you can see the consumer is willing to unleash their incredible power. 10
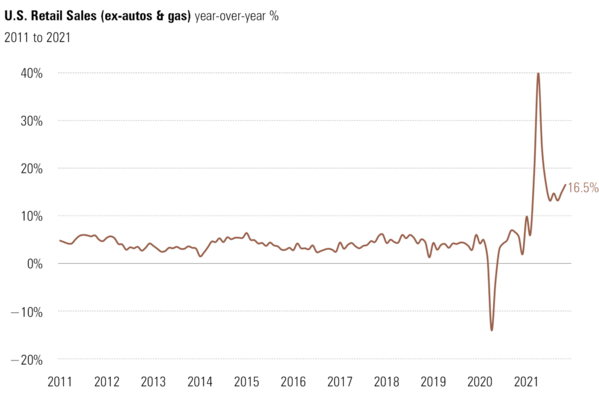
Beyond the 16.5% increase in November, the December numbers should be even stronger.
Unless there is a cataclysmic event, the consumer is poised to continue to support the economy and drive corporate earnings growth. We should take some comfort in the fact that it is not a matter of “if” they will buy.
From the entire team at Phillips and Company Advisors we want to wish you and your family a very happy holiday and Merry Christmas.
If you have questions or comments, please let us know. You can contact us via Twitter and Facebook, or you can e-mail Tim directly. For additional information, please visit our website.
Tim Phillips, CEO, Phillips & Company
Sources:
1. https://dailyshotbrief.com/
2. https://www.nytimes.com/interactive/2021/us/covid-cases.html
3. https://www.bls.gov/cpi/
4. https://www.bea.gov/data/personal-consumption-expenditures-price-index
5. https://www.mhinvest.com/blogs/depend-on-dividends-and-earnings-growth-not-multiple-expansion/
6. https://www.bls.gov/opub/ted/earnings-and-wages.htm
7. https://www.bea.gov/data/income-saving/personal-saving-rate
8. https://fred.stlouisfed.org/series/TDSP
9. http://www.sca.isr.umich.edu/
10. https://www.census.gov/retail/marts/www/timeseries.html