Behind the Curve

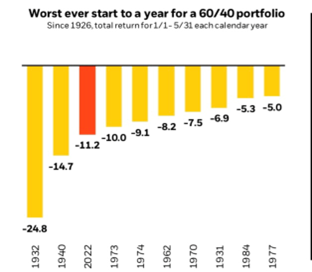
It’s been a nasty year for portfolios, especially those traditionally considered conservative like the 60/40 stock/bond portfolio. 1
Much of the portfolio headwind is being driven by raising rates and the Fed’s policy to combat inflation. Bonds typically act as an anchor to falling stocks, but not during rising rate periods.
The recent report on U.S. inflation will clearly not help investors, especially those of us looking for more inflation moderation as the year rolls forward.
The consumer price index rose by 8.6% on a year-over-year basis in May and core CPI (ex food and energy) was up 6.0% year-over-year. These are record levels not seen since the 1980s. 2
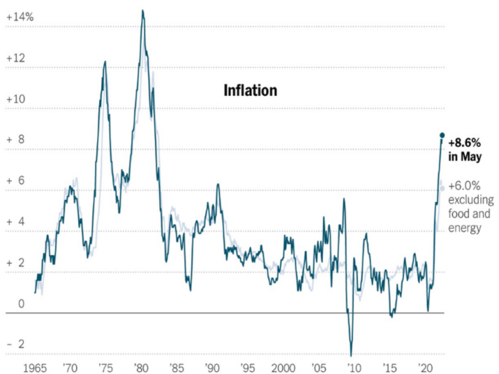
While hard to see in the chart above, core consumer prices ex-food and energy have plateaued.
The bulk of the 8.6% reading is in food and energy, including eating out and elevated airfares driven by very high jet fuel costs. 3
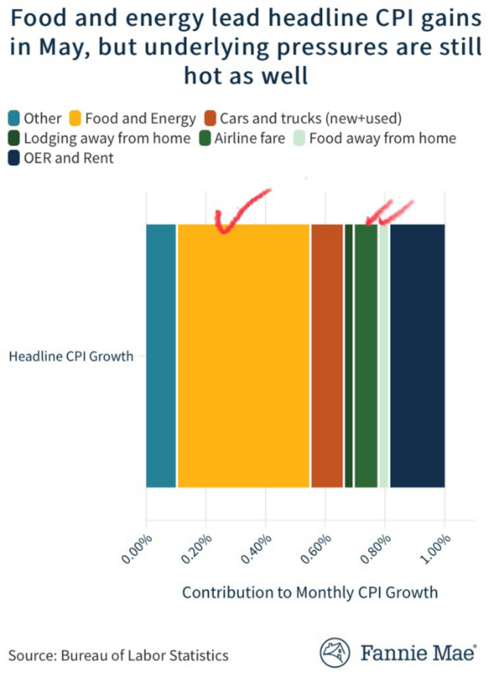
Here’s the breakdown by segment. While some of these are not traditionally counted in the food and energy categories, they are materially impacted by rising prices. 4
In fact, on a percentage basis, food and energy has contributed the most to overall inflation from April to May.
40% of the most recent inflation reading was driven by food and energy
Here’s the point: Federal Reserve interest rate policy can’t address food and energy inflation. It’s not rocket science; the Fed can raise rates and put people on the street without a job. There is no question they have the tools to do that.
However, people need to eat, and people need to drive so how do rising interest rates impact food and energy? In a prior post, Demand Destruction, the data suggests that rising rates barely dents demand in those two categories. This is exactly why the Fed doesn’t consider food and energy in their mandate. Monetary policy can do very little to address food and energy inflation.
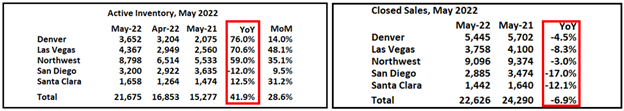
Rising interest rates can squash demand for housing, rents, recreation, appliances, clothing, and a whole host of other consumables. Take a look at what just a 1% increase in the Fed Funds rate did to housing. Active housing inventory in some select markets is up nearly 42% on a year-over-year basis and closed sales are down almost 7%. 5
Again, looking at the non-food and energy (core inflation) segments can leave one contemplating supply chains, trillions in pandemic relief pumped into the economy by the federal government, and tariffs on imported goods from China among other factors.
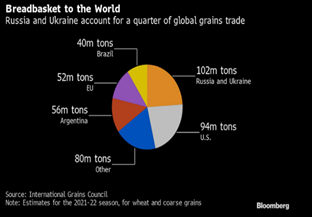
Perhaps this is why you don’t see Fed policy reflecting a stance that combats overall inflation. So many smart economists call out the Fed for being behind the inflation curve. Indeed, they may be, however it’s my view the political economy (aka politicians) can and must address inflation as it relates to food and energy. More domestic refineries, more energy from the Middle East, more grain from Russia and Ukraine (25% of global grains come from Ukraine and Russia), and more alternative energy sources just to name a few are all within our political class to solve. 6
That’s why famed economist John Cochrane, myself, and the Federal Reserve believe core inflation will dissipate over time as supply chain issues ease and consumers tap the breaks on non-food and energy consumption. All without having to push the Fed Funds rate up much higher than 3%. 7
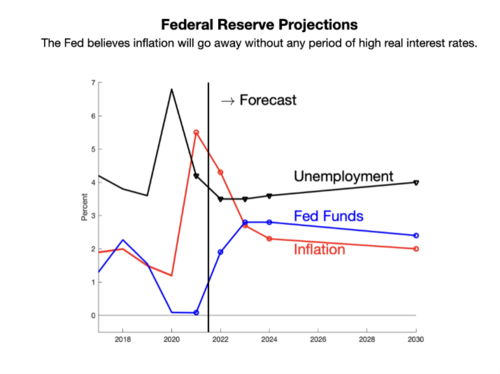
The Fed may not be behind the curve and just grasps the limitations to their interest rate policy. This week when the Fed meets to set interest rate policy, I suspect we will see a 50-75 basis point increase and some more clarity on the difference between core inflation (ex-food and energy) and headline inflation. The Fed shouldn’t put people out of work to solve geopolitical problems like accessing more refined oil from the Middle East or grains from Ukraine and Russia.
Here’s the good news. If the Fed is intentionally behind the curve as I suspect they are, the traditional 60/40 conservative portfolio should see a typical rebound. 1
If you have questions or comments, please let us know. You can contact us via Twitter and Facebook, or you can e-mail Tim directly. For additional information, please visit our website.
Tim Phillips, CEO, Phillips & Company
Sources:
- https://www.blackrock.com/us/financial-professionals/literature/investor-education/student-of-the-market.pdf
- https://www.nytimes.com/2022/06/10/business/economy/may-2022-cpi-inflation.html
- https://www.fanniemae.com/research-and-insights/forecast/may-inflation-shows-few-signs-slowing-likely-will-continue-pressure-consumers
- https://www.bls.gov/cpi/
- https://calculatedrisk.substack.com/p/1st-look-at-local-housing-markets-753?s=r
- https://www.bloomberg.com/news/articles/2022-02-28/vital-food-supply-choked-off-with-russia-ukraine-crops-in-limbo
- https://johnhcochrane.blogspot.com/2022/05/monetary-policy-conference-and.html