China Charts

There’s only so much one can write about the ongoing battle between inflation, interest rates, and stock prices in the United States. The past several posts cover that topic with sufficient rigor.
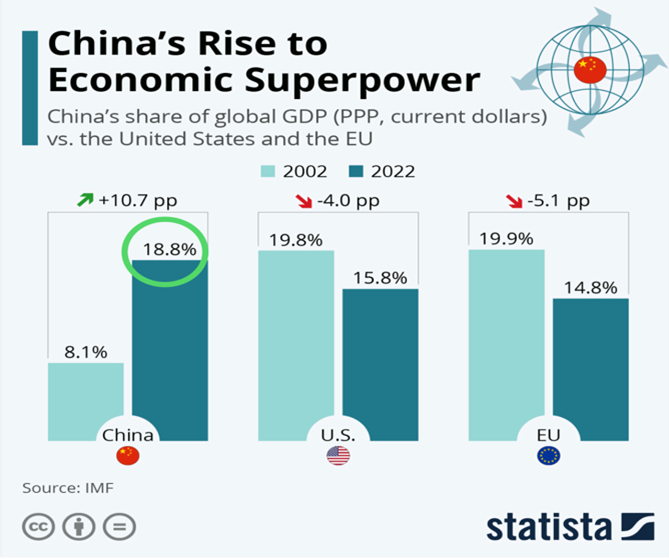
Perhaps I will pivot to the second largest economy in the world, China, and give them a little coverage. After all, they represent nearly 19% of the world’s GDP. 1
China is in the middle of their “two sessions”. This is a gathering of the policymakers discussing and approving the coming year’s plans. The headline from the meeting so far is the 5% GDP growth target for the economy. 2
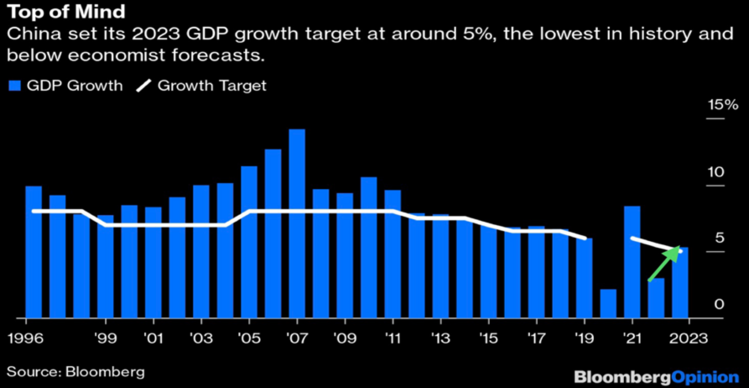
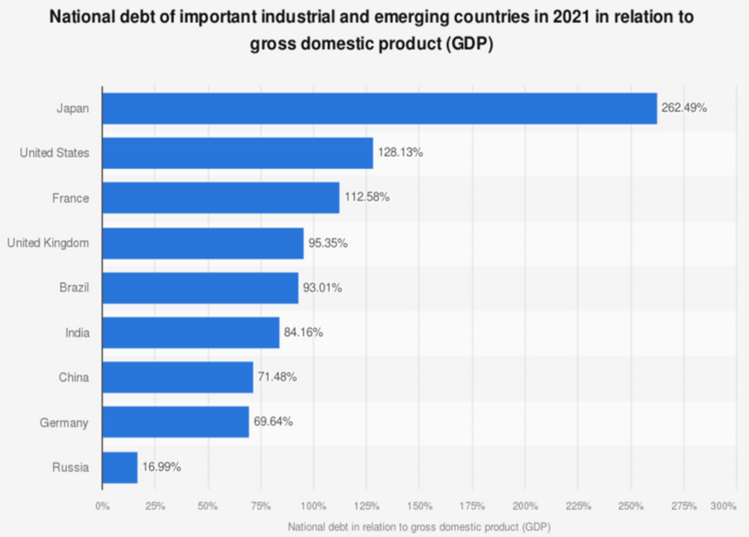
The initial reaction to this presumably slower growth target might suggest more trouble ahead. However, it’s clear to those of us that invest in China, that a 5% growth target suggests the government does not want to over stimulate the traditional economic levers: property and infrastructure. Further, it suggests China does not want to let their debt levels run too hot, similar to the United States. 3
Finally, the moderate growth target suggests China will continue to promote a “dual circulation” process of driving domestic consumption and continuing to promote export growth. 4 5
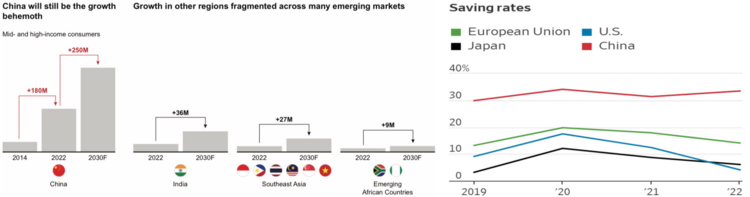
After all, China has the fastest growing, middle-class, high-income consumers, according to Bain. In addition, those consumers are sitting on record high savings.
Just imagine what would happen to the 5% growth rate if China’s domestic policy can restore trust with the public post the draconian Covid lockdowns? Further, if the CCP can sort out their challenges with their pension and health care systems; the Chinese consumer might be more aggressive. 6
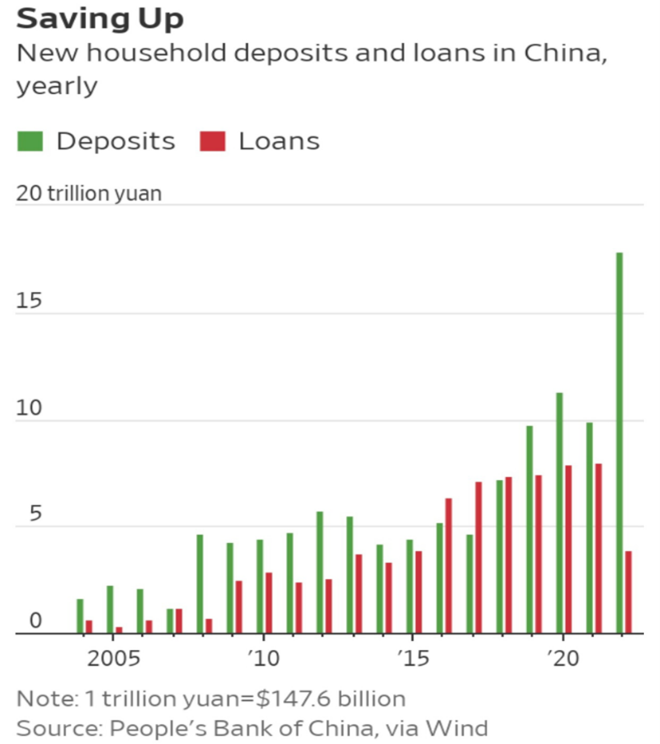
According to the Wall Street Journal, in 2022 the Chinese consumer added nearly 18 trillion in Yuan deposits, or 2.6 trillion in U.S. dollars. That’s about 15% of their 2022 GDP.
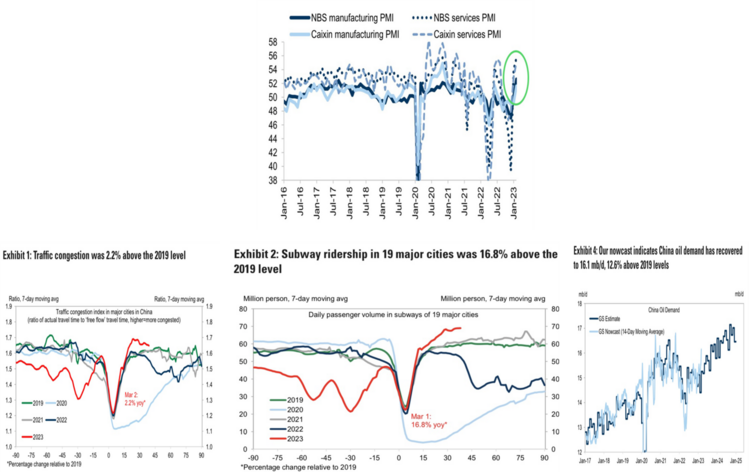
So far it looks like the population is getting back to normal post Covid lockdowns and the most recent Covid wave. Manufacturing and services have now recovered to pre-Covid levels. Transportation and oil consumption are also above 2019 levels. 7
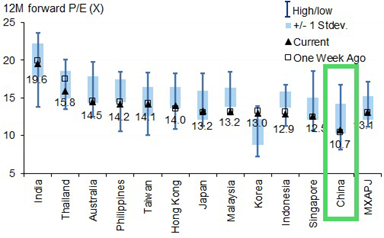
The Chinese population is gaining momentum, and I suspect the flows into the domestic equity markets will follow suit. When you consider other emerging market valuations relative to China, the 10.7x forward PE is a real value. 7
We believe China should be a small component of any portfolio containing emerging markets and the China charts suggest just that.
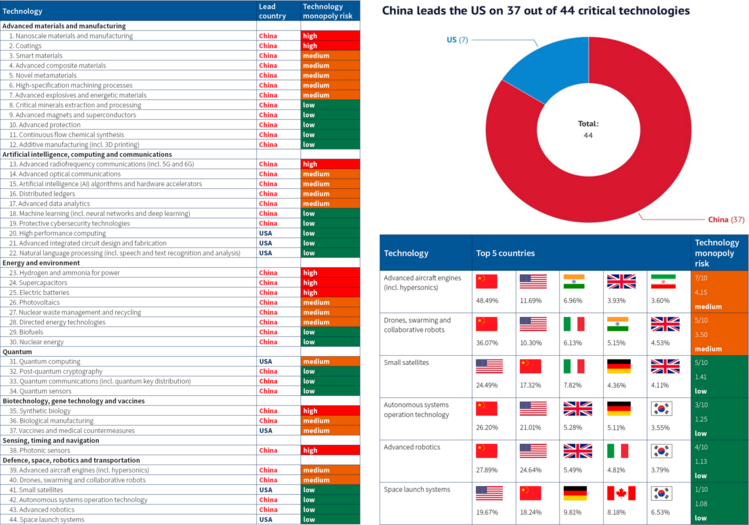
Bonus Chart – Who is more tech dominant?
According to a recent study by the Australian Strategic Policy Institute, China wins by a landslide.
It should come as no surprise that the United States is working diligently to suppress China’s technology superiority. We have been asleep at the switch for far too long. 8
If you have questions or comments, please let us know. You can contact us via Twitter and Facebook, or you can e-mail Tim directly. For additional information, please visit our website.
Tim Phillips, CEO, Phillips & Company
Sources:
- https://www.statista.com/chart/27688/chinas-share-of-global-gdp-vs-the-us-and-the-eu/
- https://www.bloomberg.com/opinion/articles/2023-03-05/china-gdp-target-a-sign-crackdowns-are-not-yet-over
- https://www.statista.com/statistics/264647/national-debt-of-selected-countries-in-relation-to-gross-domestic-product-gdp/
- https://research.cicc.com
- https://www.statista.com/statistics/1218119/savings-as-share-of-disposable-income-in-selected-countries/
- https://dailyshotbrief.com/
- https://research.gs.com/
- https://www.aspi.org.au/report/critical-technology-tracker