Inflection Point

Last week served as a stark reminder that equity markets, in the short term, can be volatile and present significant risk. On October 10, the market dropped 831 points, driven by several reasons. When taking the full three-day correction into consideration, the Dow Jones, S&P 500, and Nasdaq all dropped slightly more than 5 percent. [i]
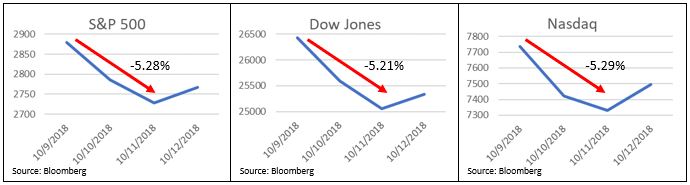
Market commentators advanced several reasons for this recent correction, but from my perspective, it’s simple: rising interest rates.
The 10-year treasury yield rose to 3.23 percent, a level we have not seen since May 2011. [ii]
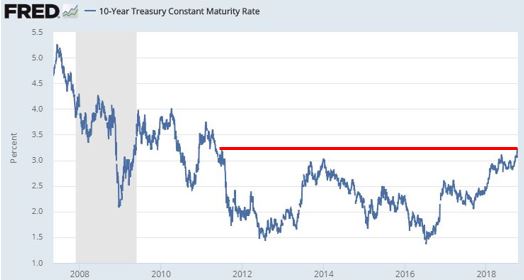
Why is this significant? Higher rates mean a few things:
- Fixed income investments could become a reasonable alternative to equity investments, leading to an outflow from equities and a subsequent inflow to various fixed income securities.
- Rising interest rates suggest higher borrowing costs for consumers and businesses.
- Rising interest rates may also influence profitability and earnings growth for many businesses.
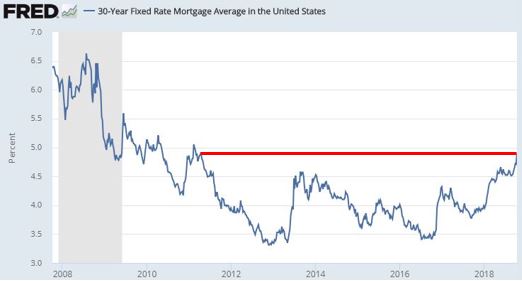
In fact, the 30-year mortgage hit 5 percent; a rate we haven’t seen that high since April 2011. [iii]
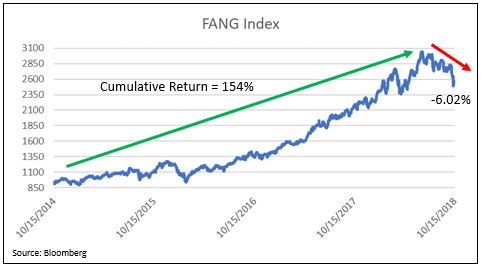
Add to this the technology sector (as measured by the FANG Index—Facebook, Amazon, Netflix, Google) experienced a significant correction, driven in part by elevated trade-war concerns between the U.S. and China. It would seem that what goes up, does tend to come down—at least in the short-term. [i]
This all leads me to believe we are at an inflection point.
Keep in mind, inflection equals correction, not crash!
What I’m suggesting is we are likely at a new phase in the market. A phase with much higher volatility, albeit from the low levels we are accustomed. When you look at the current spike in volatility, as measured by the VIX Index, you can see we have not been this high since February, the last time we had a correction of similar magnitude. [i]
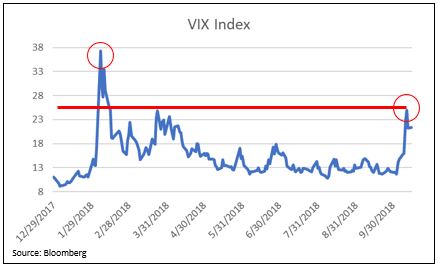
What’s fascinating is this magnitude of correction is accompanied by almost half the volatility compared to what we saw last February. [i]
Furthermore, the type of inflection point I’m suggesting is a matter of more frequent corrections—something consistent with the historical averages. [iv]
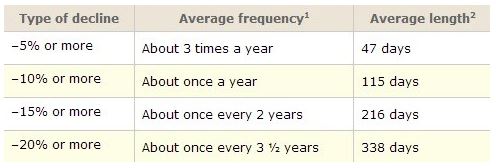
To date, we now have had two corrections of 5 percent or more in 2018. Historically, that number is more like three. Perhaps we have one more correction of this magnitude in store for us, sometime before the end of the year. Maybe we will even start to see a sustained 10 percent equity correction, which would be consistent with past markets. That’s the type of inflection point I’m talking about.
Why not a market crash, or a bear market yet?
Because earnings growth and valuations suggest we have some downside support.
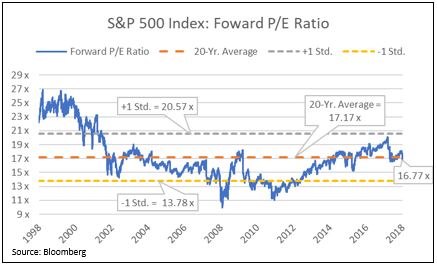
As a result of the latest market pullback, valuations on the S&P 500 have moved below the long-term 20-year average. At these levels, it’s tough to make the argument that stocks are overpriced by any significant measure. [i]
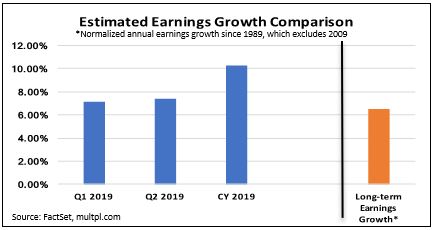
Add that to our 2019 expectations for reasonable earnings growth of 10 percent. Investors appear to be starting to look to the future, and, frankly, they may not be disappointed with 10 percent earnings-per-share growth. [v]
As I said, we’re likely at an inflection point. In this phase, it may not be the start of a bear market (defined as a 20 percent correction in equity prices), but there will likely be more increased levels of volatility. In fact, individual behavior may be the real inflection point, as investors are forced to stare down normal amounts of market volatility, which many have not had to do in quite some time.
That’s the inflection point I am talking about.
If you have questions or comments, please let us know. You can contact us via Twitter and Facebook, or you can e-mail Tim directly. For additional information, please visit our website.
Tim Phillips, CEO, Phillips & Company
Robert Dinelli, Investment Analyst, Phillips & Company
References:
i. Bloomberg, L.P.
ii. https://fred.stlouisfed.org/series/DGS10#0
iii. https://fred.stlouisfed.org/series/MORTGAGE30US#0
iv. https://phillipsandco.com/blog/breathtaking/
v. https://phillipsandco.com/files/6615/3876/8981/Look_Ahead_2018Q4_-_Final.pdf