Measuring Sleepless Nights
Measuring Sleepless Nights
Weekly CEO Commentary 1-28-13
Tim Phillips, CEO—Phillips & Company
I was recently asked by a client to explain what standard deviation is as it relates to investments and what's a good number. Two things struck me about the questions. One, it's a great question that merits an answer, and the other is a reminder to all professionals in my field, including me, to speak English and not complicate matters.
Most of you reading this will likely care very little about the standard deviation of your portfolio. You outsource those issues to us and depend upon our background, experience and analytical ability to deal with such technical issues.
What I have learned though over the many years is that standard deviation impacts every investor in a very personal way. Allow me to explain.
Standard deviation (which we will abbreviate as SD), when it relates to your portfolio, is a measure of how much your portfolio moves up and down from its average return. Basically, it is a measure of volatility.
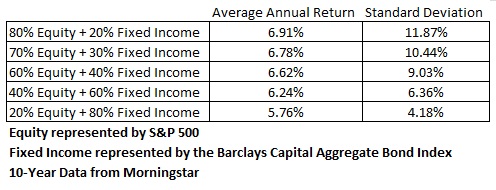
As you can see from the table above, a sample 60% Equity/40% Fixed Income portfolio over a 10 year period has an average return of 6.62% with an annualized SD of 9.03%. That means in any one year period given a 1 SD event, this portfolio could move up or down from its average by 9.03%, to -2.41% or 15.65%.
Unfortunately, this is not very real world.
What constitutes a 1 SD event? That's a really hard question to answer as almost everything falls within a 1 SD event: earnings reports, economic releases, government interventions (tax policy and budget problems) interest rate movements—the list can go on. You can see from the table below that 95.5% of the issues that impact a portfolio are within a 1 SD event.
Table: Percentage of standard deviation events by time period
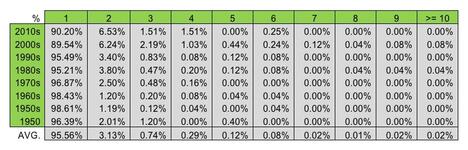
Source: CFA Institute.
To add a bit more real world to this example, let's take a look at pretty big standard deviation periods. According to the CFA Institute, "the largest positive [SD] event of all time occurred on 13 October 2008, when the S&P 500 surged upward 11% registering as an 11.82 [SD] event.” This was due to central banks coordinating easing policies to calm credit markets. Meanwhile, the largest negative SD event was the famous 19 October 1987 crash, which was a whopping 20.98 SD event! (I have experienced both as a professional advisor as I am sure many of you have as an investor).
Table: Actual number of standard deviation events.

Source: CFA Institute.
Conclusion
In real world terms, standard deviation is a measurement tool that should be used by you to measure your threshold for pain, ability to withstand that pain, and time needed to survive it. If you think you might lose sleep at night when your 60/40 portfolio drops by 1 SD or 9.03%, you might have to get used to sleeping less. It's a fairly regular occurrence—but it also happens on the upside as well.
Of course, we spend considerable time trying to reduce the SD in a portfolio while minimizing the impact on the returns you could experience. Pragmatically, it's really your ability to deal with the standard deviation/volatility that allows us to generate the returns you need.
That's why I always remind investors that sometimes going overly conservative and sleeping well today may not lead to living well tomorrow.
If you have questions or comments please let us know as we always appreciate your feedback. You can get in touch with us via Twitter, Facebook, or you can email me directly. For additional information on this, please visit our website.
Tim Phillips, CEO – Phillips & Company
Research supported by:
Alex Cook, Associate – Phillips & Company