More Money!
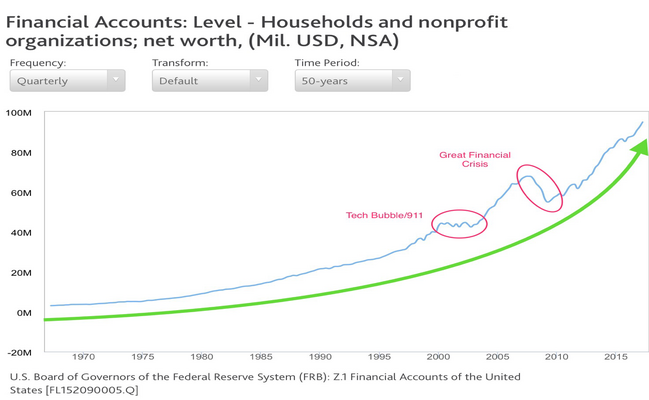
While everyone was focused on the political circus in Washington DC last week, a little tidbit of news went largely ignored by the American public. According to the Federal Reserve’s latest Q1 statistical release, Americans are the wealthiest that they have ever been. [i]
Although American wealth has been steadily climbing for nearly fifty years, experiencing only a few small hiccups along the way, this Federal Reserve report is noteworthy for a few reasons. [ii]
First, it signifies a significant percentage jump in household net worth in comparison to prior periods.
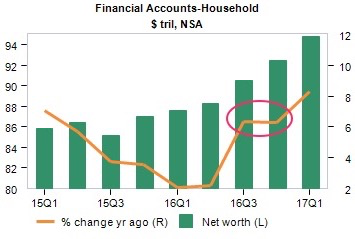
In fact, year-over-year gains increased by 8.3 percent, representing the strongest gains in three years. From the prior quarter alone, wealth climbed to $2.3 trillion, or 10.5 percent. [iii]
Second, much of the gain is coming from financial assets rather than from real estate assets. This is a bit of a surprise, given how profitable the real estate market has been in recent years. [iii]
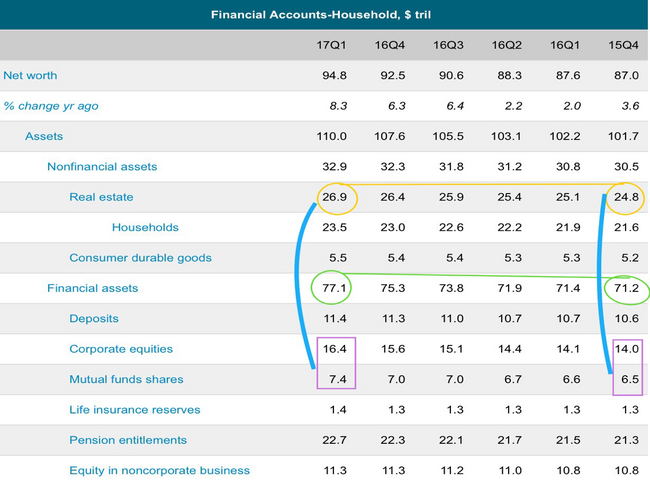
To obtain a bit more context, compare the $24.8 trillion in real estate during Q4 2015 to the $20.5 trillion invested in equities and mutual fund shares during the same period. Roll forward to Q1 2017, and you can see that equities and mutual fund shares have grown to $23.8 trillion; an increase of $3.3 trillion. Comparatively, real estate has only grown by $2.1 trillion. Additionally, then compare that $2.1 trillion growth in real estate to the overall growth in financial assets of $5.9 trillion ($71.2 trillion to $77.1 trillion). [iii]
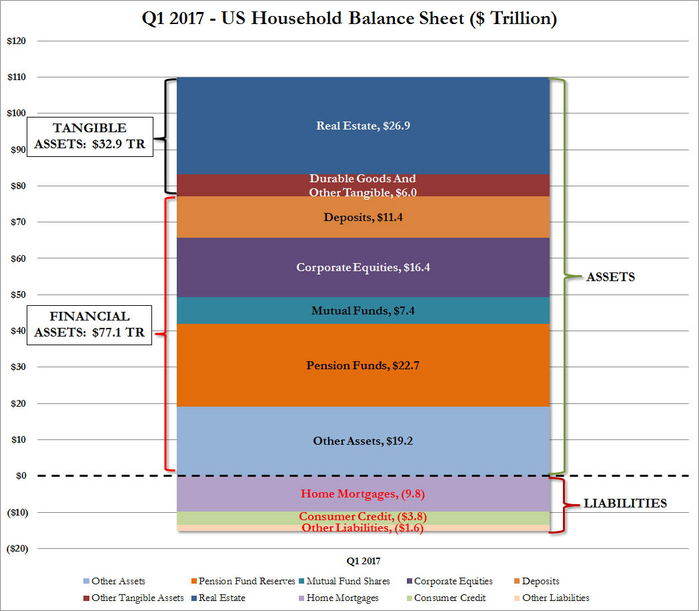
The importance of financial assets relative to real assets (e.g. real estate and durable goods) is reflected in the balance sheet below. [iv]
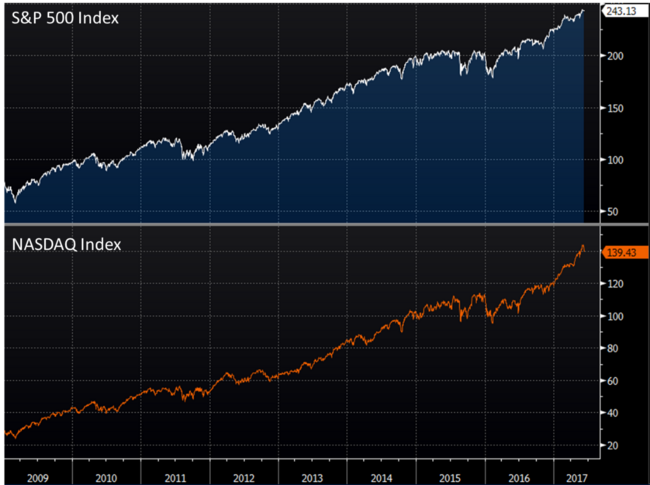
When comparing the growth in financial assets from Q4 2015 to now, you only have to look at the S&P 500 or the NASDAQ to get a quick picture of what has been driving this growth. [v]
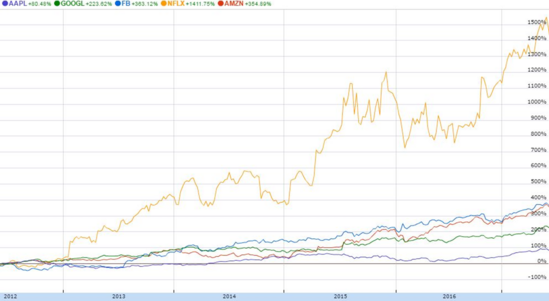
If you break the financial assets growth down further, you will see that much of this growth has been concentrated in a few large stocks; in particular, Apple, Facebook, Amazon, Netflix, and Google. [vi]
A few takeaways from all this data are as follows:
- Growing wealth generally supports consumer confidence and spending
- We may be less susceptible to a negative wealth effect if we have another housing correction
- The concentration of a few companies driving equity index prices higher creates a new kind of concentration risk as it relates to our current personal balance sheet
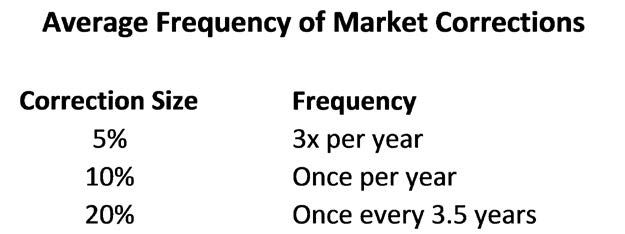
- We may be much more vulnerable to the impact of a prolonged equity correction when it lasts longer than average [vii]
Finally, the following chart shows that our current balance sheet risk is a bit more diversified than you may think. The vast majority of the current wealth created by the stock market only goes to a very small percentage of people. [viii]
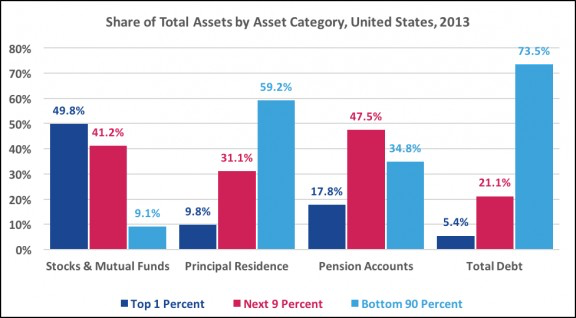
Although we would all like better distribution of wealth, the good news is that the bottom 90 percent of consumers drives most of our consumption. In fact, a prolonged equity correction may not derail their consumer habits as much as it would derail the top 1 percent. A real estate correction, however, is another story, though we did just live through one.
If you have questions or comments, please let us know. We always appreciate your feedback. You can contact us via Twitter and Facebook, or you can e-mail me directly. For additional information, please visit our website.
Tim Phillips, CEO, Phillips & Company
Robert Dinelli, Investment Analyst, Phillips & Company
References:
i. https://www.federalreserve.gov/releases/z1/current/z1.pdf
ii. https://www.economy.com/dismal/data/chart/?mnemonic=XZFL152090005Q.IUSA
v. Bloomberg LP
vi. Google Finance